✈️😊 Predicting Airline Customer Satisfaction with Machine Learning
(Tree Based Models & XGBoost)
Predicting Airline Customer Satisfaction with Machine Learning
 Image Source: https://www.retently.com/blog/airline-satisfaction/
Project Overview
- 3 different supervised machine learning models were created to predict customer satisfaction
- All 3 models built performed greatly in predicting customer satisfaction, these were also able to identify 3 most important predictors.
- Decision Tree Model
- Scores: F1 95%, Recall 94%, Precision 96%, Accuracy 94%
- 3 Most important predictors:
- Inflight Entertainment
- Seat Comfort
- Ease of Online Booking
- Random Forest Model
- Scores: F1 95%, Recall 94%, Precision 95%, Accuuracy 94%
- The 3 Most important predictors were the same as Decision Tree
- XGBoost Model
- Scores: F1 94%, Recall 93%, Precision 95%, Accuracy 93%
- 3 Most important predictors:
- Seat Comfort
- Food and Drink / Age
- Gate Location
- Recommendations given were focused at improving Inflight Entertainment, Seat Comfort, Ease of Online Booking, as well as improving overall satisfaction through other methods.
Access the IPYNB files here:
Objectives
- The airline is interested in predicting if customers are satisfied with their services, given customer feedback about their flight experience.
- As a data analyst, I am tasked to construct and evaluate a model, and identify which features are most important for satisfaction.
- The data contains 129,880 survey responses with data on class, flight distance, and in-flight entertainment, among others.
- Basic EDA, data cleaning and preparations are required before building the model.
- Recommendations are to be given to improve customer satisfaction.
Project Process
The overall process for the creation of models are as follows:
- Importing packages and loading data
- Exploring the data and completing the cleaning process
- Building the 3 machine learning models
- Tuning hyperparameters using
GridSearchCV - Evaluating models using a confusion matrix and feature importances
- Providing recommendations for points of focus for the airline
Project Context
- The data was used with 3 different machine learning models in separate jupyter notebook files, however, all models will be compiled in this portfolio blog.
Decision Tree Steps Taken
Expand for Steps Taken and Model Visualizations
1. Import, Loading and Preparation of the Dataset
- Use of functions
.head(),.dtypes,.unique(), - There was not much data imbalances with 55% satisfied, and 45% dissatisfied.
- There were 393 missing values in Arrival Delay, a separate instance was created and these values were dropped
Satisfaction, Customer Type, Type of Travel and Classwere encoded to numerical values for our models using.map()and.get_dummies()functions.- the
train_test_splitwas used to separate 75% of the data for training and 25% for testing.
2. Model Building and Parameter Tuning
- As we instatiate the Decision Tree Classifier and fit our data, we get great scores, however this can still be improved through tuning.
Hyperparameter Tuning
- After running gridsearch for awhile, we get the best params and scores:
- Best Index: 15
- Best Estimator: DecisionTreeClassifier(
- max_depth=18,
- min_samples_leaf=2,
- random_state=0) Best Parameters: {‘max_depth’: 18, ‘min_samples_leaf’: 2} Best Score: 0.9454
F1 Score: 94.54, Recall: 93.59, Precision: 95.52, Accuracy: 94.09
3. Model Interpretation
Confusion Matrix
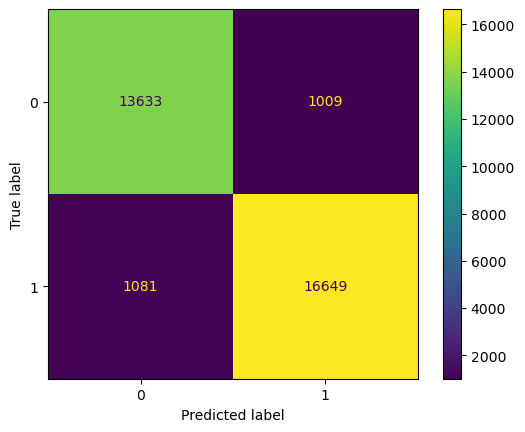
Let’s plot a confusion matrix to identify the types of errors made in our model’s predictions.
Recall that:
- Top Left: True Positives - Predicted satisfied and actually satisfied.
- Lower Right: True Negatives - Predicted unsatisfied and actually unsatisfied.
- Top Right: False Positives - Predicted satisfied but actually unsatisfied
- Lower Left: False Negatives - Predicted unsatisfied but actually satisfied.
- The model has accurate predictions between the true positives and true negates.
- False positives and false negatives also have an equal number, both being generally low compared to the true positives and negatives.
- Overall, the model’s performance is great at identifying a customer’s satisfaction based on the given predictors.
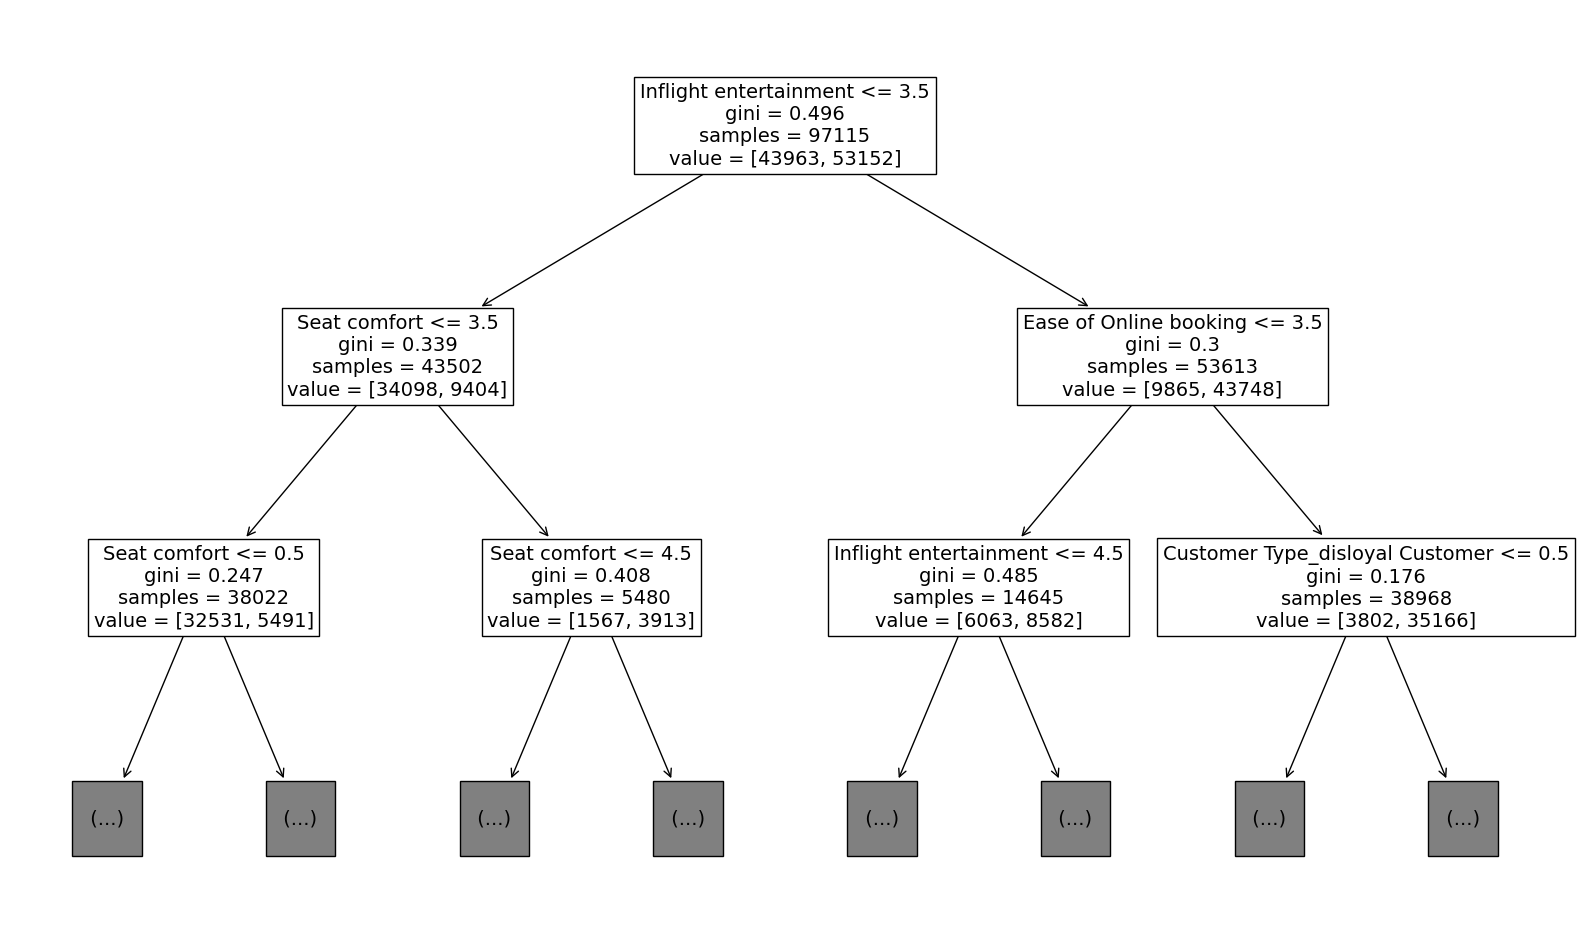
Decision Tree Visualized
Let’s plot the decision tree to see how it split the data based on its gini impurity.
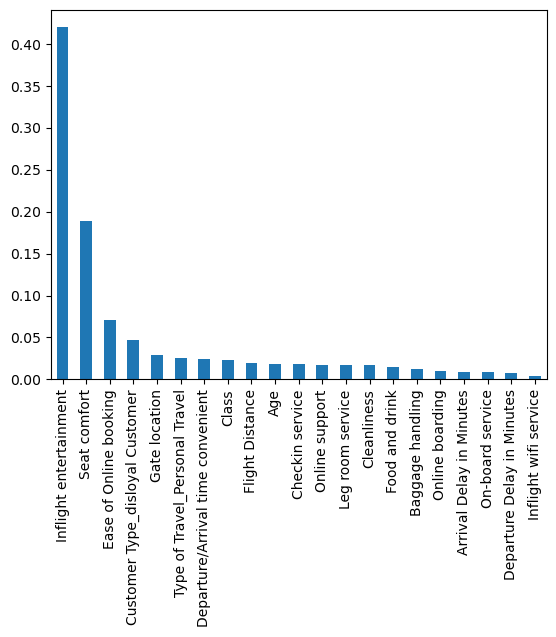
To create a more digestible visual, let’s create a plot for the most important features.
- Through this we are able to identify the top factors that lead to customer satisfaction being
- ‘Inflight entertainment’,
- ‘Seat comfort’,
- ‘Ease of online booking’.
- The model has a good performance and accurately predicted satisfaction 94% of the time.
- The confusion matrix also shows a good performance and an equally low amount of false positives and negatives in relation to the true positives and true negatives.
- Recommendations will be given at the end
Random Forest Steps Taken
Expand for Steps Taken and Model Visualizations
1. Import, Loading and Preparation of the dataset
- Same as before:
- Use of functions
.head(),.dtypes,.unique(), - There were 393 missing values in Arrival Delay, a separate instance was created and these values were dropped
Satisfaction, Customer Type, Type of Travel and Classwere encoded to numerical values for our models.get_dummies()functions.- the
train_test_splitwas used to separate 75% of the data for training and 25% for testing.
2. Model Building and Parameter Tuning
- For the best model performance, we set some hyperparameters for tuning the model using
GridSearchCV - Create a list of split indices using
PredefinedSplit()to identify points from the train set will be treated as validation data during GridSearch. - After fitting the model, we obtain our most optimal parameters:
- {‘max_depth’: 50
- ‘max_features’: ‘sqrt’,
- ‘max_samples’: 0.9,
- ‘min_samples_leaf’: 1,
- ‘min_samples_split’: 0.001,
- ‘n_estimators’: 50}
3. Model Interpretation
- Using our best parameters, we fit the optimal model and predict on test set.
- Here is our tuned model’s scores on the test set compared to the decision tree
| Model | F1 | Recall | Precision | Accuracy |
|---|---|---|---|---|
| Tuned Decision Tree | 0.95 | 0.94 | 0.96 | 0.94 |
| Tuned Random Forest | 0.95 | 0.94 | 0.95 | 0.94 |
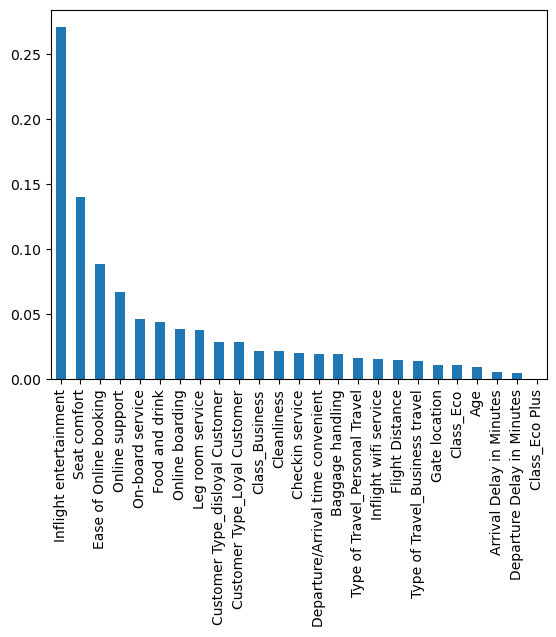
We can also plot the feature importances to have an idea of the most important predictors as identified by our Random Forest.
- Like our decision tree, the top 3 most important features are Inflight Entertainment, seat comfort and ease of online booking.
- Compared to our decision tree, the random forest is marginally better at 3 scores, only by 0.01-0.002. Precision is better with our decision tree but only by 0.005.
XGBoost Steps Taken
Expand for Steps Taken and Model Visualizations
1. Import, Loading and Preparation of the dataset
- Same as before:
- Use of functions
.head(),.dtypes Satisfaction, Customer Type, Type of Travel and Classwere encoded to numerical values for our models.get_dummies()functions.- One of the advantages of Gradient boosting machines is that it works well with missing data. Missing data is information. We will no longer eliminate null values for this.
the
train_test_splitwas used to separate 75% of the data for training and 25% for testing.
2. Model Building
- We start by instantiating our XGBClassifier, setting parameters for our GridSearch and defining our scoring metrics.
- We then fit the grid search to our training data.
- We obtain our best parameters:
- Best Parameters:
- ‘colsample_bytree’: 0.7
- ‘learning_rate’: 0.3
- ‘max_depth’: 6
- ‘min_child_weight’: 3
- ‘n_estimators’: 15
- ‘subsample’: 0.7
Best Accuracy: 93.94%
3. Model Evaluation
Here are the compiled scores for all 3 models.
| Model | F1 | Recall | Precision | Accuracy |
|---|---|---|---|---|
| Tuned Decision Tree | 0.95 | 0.94 | 0.96 | 0.94 |
| Tuned Random Forest | 0.95 | 0.94 | 0.95 | 0.94 |
| Tuned XGBoost | 0.94 | 0.93 | 0.95 | 0.93 |
- Precision of 94.72% tells us that the model is good at predictive true positives or satisfied customers.
- Recall of 93.31% lets us know that the model does a good job of correctly identifying dissatisfied passengers within the dataset.
- F1 score balances both precision and recall. With 94.01% f1, this is a strong predictive power in the model.
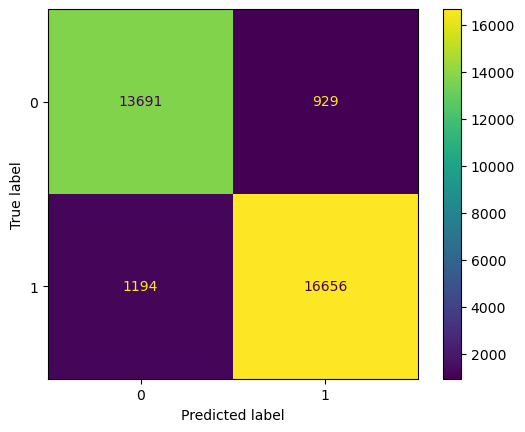
Similar to our Random Forest, we can utilize a Confusion Matrix to visualize the predictions of our model.
- The True Positives and True Negatives in the top left and bottom right are very high with 13000 and 16000 respectively, in relation with the False Positives and False Negatives, this helps us visualize why the is accuracy and other metric scores is high.
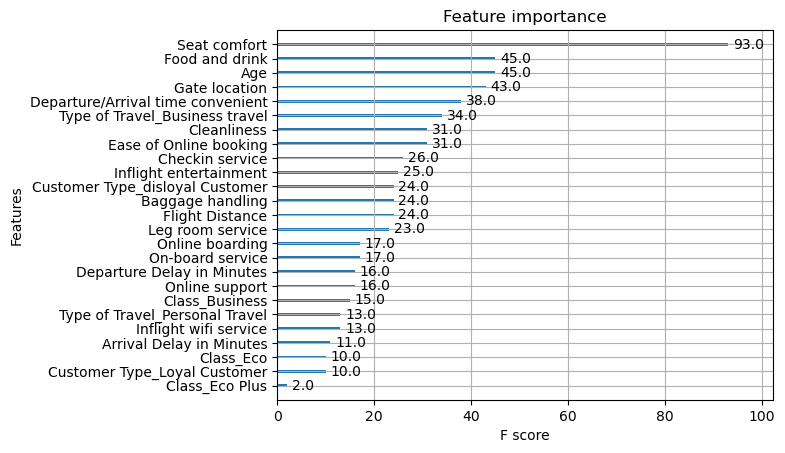
- Unlike our previous models, this one has different features identified as the most importance:
- Seat and comfort, food and drink, and age was the most important here, followed by gate location and departure time.
Conclusions and Recommendations
Again, here are the compiled scores for all 3 models:
| Model | F1 | Recall | Precision | Accuracy |
|---|---|---|---|---|
| Tuned Decision Tree | 0.95 | 0.94 | 0.96 | 0.94 |
| Tuned Random Forest | 0.95 | 0.94 | 0.95 | 0.94 |
| Tuned XGBoost | 0.94 | 0.93 | 0.95 | 0.93 |
Insight
- In terms of model scores the Random Forest performed the best, followed by Tuned Decision Tree then the Tuned XGBoost. Despite this, differences are very marginal only by 0.01.
All 3 models were highly effective and predictive in passenger satisfaction.
- For both the Decision Tree and Random Forest the 3 most important predictors are:
- Inflight Entertainment
- Seat Comfort
- Ease of Online Booking
- For the XGBoost Model the 3 most important predictors are:
- Seat Comfort
- Food and Drink / Age
- Gate Location
- As such, recommendations will revolve around improving these.
Recommendations
From these insights, further research may be done to identify which has the best cost / improvement ratio when it comes to improving seat comfort or food and drink and so on.
Focusing on creating good inflight entertainment through improved media on airport seats (if available), or interviewing customers on what they liked the most In terms of inflight entertainment may be rewarding for the company when it comes to increasing satisfaction.
Seat comfort can be improved through investing in back rests or small pillows, improving scent or cleanliness of seats and investing in better seats for future plane selection.
In terms of Ease of online booking, A/B and statistical tests can be done to determine whether or not certain versions of the websites had faster checkouts or better conversion. Investing into UI and web development may be beneficial for the airline.
For Food and Drink, investing more in identifying customers preferences (which may differ for each location) may prove beneficial to overall satisfaction. Investing in quality ingredients, food R&D, and conducting surveys may play a big role in improving overall satisfaction.
Finally, the models are highly predictive in all metrics. Further investing into building and understanding the models will be a huge asset to the company by enabling them to do interventions/additional programs for unsatisfied clients and utilizing the model for future testing if client satisfaction improved with the recommended changes.
